
Vanity Metrics vs Actionable Metrics: What’s the Difference and What To Track in SaaS?
Choosing Actionable Metrics Over Vanity Metrics for Your SaaS Business
In the realm of SaaS, prioritizing actionable metrics over vanity metrics is paramount for ensuring the success of your product marketing endeavors. While vanity metrics may initially seem appealing, they often lack substance and can lead to misguided conclusions about business performance.
Here’s why focusing on actionable metrics is crucial for obtaining valuable product growth insights:
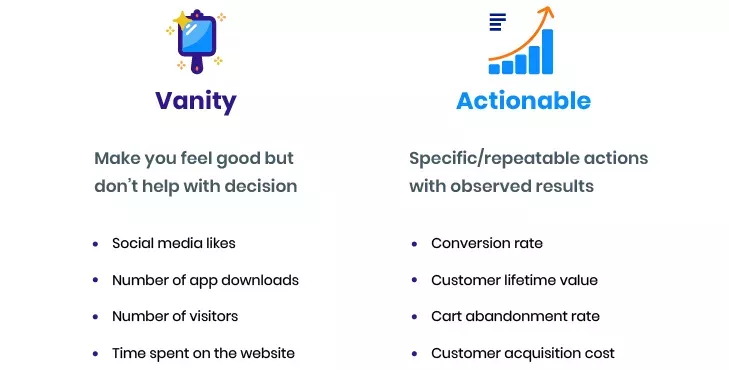
1. Vanity metrics may make your business appear impressive superficially, but they fail to provide meaningful insights into business performance.
2. Actionable metrics, on the other hand, offer valuable information about business performance and facilitate the formulation of effective product growth strategies.
3. In the era of product-led growth, actionable metrics enable businesses to gauge whether their products meet customer needs and make necessary improvements.
4. Examples of vanity metrics include the number of free trial users, total customers acquired, and total users, whereas actionable metrics encompass trial-to-paid conversion rate, customer acquisition cost, and customer engagement score.
Key actionable metrics to focus on for your SaaS business include:
1. Activation rate: Measures the percentage of trial users who perform key in-app actions, indicating whether users derive value from your product.
2. Monthly Recurring Revenue (MRR): Represents the total revenue earned each month from subscriptions.
3. Customer retention rate: Reflects the percentage of customers who continue to use your product over a specified period, essential for long-term business sustainability.
4. Customer churn rate: Measures the rate at which customers cancel their subscriptions, highlighting potential revenue loss.
By prioritizing actionable metrics over vanity metrics, SaaS businesses can gain deeper insights into their performance and make informed decisions to drive sustainable growth.
Understanding Vanity Metrics in SaaS
Vanity metrics within the realm of SaaS refer to metrics that may appear impressive superficially but fail to accurately reflect the actual performance of your business. These metrics lack actionability, rendering them ineffective for informing strategic decision-making.
For example, boasting 12,000 new subscribers may seem impressive at first glance. However, if the number of monthly active users remains low at only 200, this metric lacks substance and provides little insight for formulating effective strategies.
Identifying Vanity Metrics
How do you discern which metrics are irrelevant to the growth of your SaaS business? Vanity metrics possess certain distinct characteristics that differentiate them from actionable metrics. They typically:
– Tend to be misleading
– Lack depth or substance
– Fail to contribute meaningfully to business or product improvement
– Are oversimplified to track and measure
– Lack contextual relevance
Understanding Actionable Metrics in SaaS
In contrast, actionable metrics are directly linked to specific business actions and observable outcomes. They empower marketers to align their efforts effectively around key metrics that drive business objectives. Actionable metrics are tied to aspects of your business that you can control and influence in a meaningful manner.
Importance of Tracking Actionable Metrics for SaaS Businesses
In the era of product-led growth, tracking actionable metrics is essential for understanding whether your products effectively meet customer needs and for making necessary improvements. Moreover, research from Forrester revealed that proper alignment with actionable metrics can lead to a significant increase in revenue growth.
Distinguishing Between Vanity Metrics and Actionable Metrics
Vanity metrics are deceptive and superficial, encompassing metrics such as social media followers, website traffic, and social media engagement. In contrast, actionable metrics are clearly defined and aligned with business goals. Metrics like trial-to-paid conversion rate, cart abandonment rate, and customer lifetime value enable teams to predict the trajectory of the business and formulate successful marketing strategies.
Examples of Vanity Metrics in SaaS and Alternatives to Track
Many SaaS companies often rely on vanity metrics to gauge their performance. Here are some common examples of vanity metrics and actionable alternatives to track instead:
1. Vanity Metric: Number of Free Trial Users
While knowing the number of free trial users can provide some insight, it fails to reveal how many of these users are actively engaging with your app. This metric alone cannot inform effective strategies.
Actionable Metric: Trial-to-Paid Conversion Rate
Instead of focusing solely on the number of free trial users, track the trial-to-paid conversion rate. This metric indicates the percentage of users who found value in your app and upgraded to paid accounts. To calculate it, divide the number of free trials converted into paid subscriptions by the total number of free trial signups within a specific period, then multiply the result by 100.
By shifting your focus to actionable metrics like the trial-to-paid conversion rate, you can gain deeper insights into user behavior and make informed decisions to drive growth.
Total Users: A Vanity Metric
The total number of users is often considered a vanity metric because having a large customer base doesn’t necessarily imply active and loyal users. For instance, if 10,000 individuals subscribed to a paid account in January but only 100 of them remained active on a monthly basis, the sheer volume of users becomes meaningless.
Actionable Metric: Customer Engagement Score (CES)
To address this, tracking the Customer Engagement Score (CES) offers valuable insights into the activity and engagement levels of your entire customer base, including both free trial users and paying customers. The CES assigns a score to each user based on their activity and product usage. Higher CES values indicate greater customer engagement.
Calculating the Customer Engagement Score involves:
1. Identifying key in-app events and assigning them scores ranging from 1 to 10 based on their importance.
2. Multiplying the assigned score by the frequency of each event in the last x days to obtain the total event value.
3. Summing up all the total event values to derive the overall Customer Engagement Score.
By focusing on actionable metrics like the Customer Engagement Score, you can gain a more accurate understanding of user engagement and tailor your strategies accordingly for improved customer satisfaction and retention.
Total customers acquired
This is similar to the total-users count, but this includes only the acquired and paying customers. Here too, the number of active users should make up a significant portion of the total customers acquired.
What is the actionable metric for this case?
What you should track instead is the customer acquisition cost (CAC). It measures the cost to acquire a new user for the organization, thus helping you make more informed decisions like creating a better budget for your sales and marketing campaigns. To measure this metric, divide the total sales and marketing expenses during a specific period (monthly/annually) by the number of new users acquired.
4 key SaaS actionable metrics and how to improve them?
Now let’s look at the 4 most important actionable metrics for SaaS product growth and how you can improve them.
- Activation rate
- Monthly Recurring Revenue (MRR)
- Customer retention rate
- Customer churn rate
Activation rate
The customer activation rate tells you how many of the trialists completed the key in-app actions and thus experienced the value of your product. In fact, a 25% rise in the activation rate boosts the monthly recurring revenue by 34%. The in-app events depend on the particular user persona a customer belongs to.
How to improve customer activation rate?
New product marketing trends showcase the importance of building behavioral and personalized user onboarding experiences in improving activation. Use behavioral analytics to set up relevant triggers depending on specific user behavior or lack thereof.
Furthermore, you can give customers a better experience by gaining a better understanding of their behavior and needs. You can personalize onboarding in multiple ways, such as by:
- user behavior
- milestones
- user state
- user role
To build a behavioral flow in onboarding, you can set the activation events in 2 ways:
- Monitoring and analyzing critical in-app events that would make customers reach the activation milestone. Here, customers actively use your product to meet their objectives.
- Determining the various user personas. Segment your customer base into different groups based on characteristics like user role, knowledge, age, etc. This allows you to easily identify the key triggers for both AHA moment and activation for each group.
Personalization involves using onboarding elements like checklists, tooltips, interactive walkthroughs, etc. that contextually help users reach the activation point.
Onboarding checklists, like the one given below, break down a complex process into simpler tasks to make it easier and quicker for users to find value.
You can add a progress bar to the checklist to help users keep track of their progress and motivate them to move forward. Therefore, checklists are a valuable tool for improving the activation rate.
Monthly Recurring Revenue (MRR)
The Monthly Recurring Revenue (MRR) is the stream of revenue you earn each month from subscriptions. To find your MRR, multiply the number of monthly subscribers by the Average Revenue Per User (ARPU). If your company depends on annual subscriptions instead of monthly, just multiply the MRR by 12 to get the yearly figure.
How to improve monthly recurring revenue?
Use onboarding modals to improve your monthly recurring revenue. They are large UI elements that are used for in-app messaging.
You can leverage modals to drive account expansion in a contextual manner. The greater the account expansion, the higher your MRR will be.
Modals are considered to be the most intrusive type of in-app messaging. This is why it’s advisable to use them in moderation and use them for making key announcements, such as the launch of a new feature or the need to upgrade to unlock some necessary features.
Therefore, modals tend to be a very effective automated upgrade process. They help users notice the additional value an upgrade can provide right when they need it.
The modal below pops up when a user wants to access some features that are restricted by their free account or current subscription plan. It also adds a visible call-to-action button to prompt users to take action.
Customer retention rate
The customer retention cost is a measure of the customer retention rate. Customer retention cost measures how much you spend per user to retain them in the long run. Thus, it’s equal to the total annual cost of customer success and retention teams and their initiatives divided by the total number of active users.
A Forbes research showed that it costs 5 times less to retain existing customers than to acquire new ones.
How to improve customer retention rate?
Continuous onboarding is crucial for improving the customer retention rate. This is because users won’t stick around unless you keep driving value as they move across their user journey.
Onboarding is an ongoing process of making users learn by doing.
As you engage users with personalized in-app messaging and provide in-app guidance, they are finally able to access all features relevant to their use case. And as your product benefits them more and more, they keep renewing their subscriptions.
Below is the multiple AHA moments journey. AHA moment is when a user realizes the expected value of your product. Users need to experience more such moments after the initial one each time they get to know about a valuable feature.
After activation, secondary onboarding comes into play. Users discover relevant secondary features and adopt them when they get value. Finally, repeated value boosts retention, and customers may even become brand advocates and spread positive reviews.
Customer churn rate
Churn is the opposite of retention. The customer churn rate is the number of customers you lost from subscription cancellations during a specific period divided by the number of customers present at the beginning of that period, multiplied by 100.
This metric helps you measure the revenue loss from the churn and also take actions to address customer pain points.
How to improve the customer churn rate?
Your churn rate might be below the industry average but will still not be zero. However, you can reach negative churn by increasing your revenue up to a point after which it surpasses the sum you lose from churn.
Secondary onboarding efforts help to reduce churn while improving retention at the same time. Onboarding tools like tooltips, interactive walkthroughs, and checklists come in handy again here.
In addition, collecting user feedback from in-app churn surveys allows you to understand why your customers are leaving and make improvements accordingly. You can even add suggestions along with it to encourage users to pause their accounts instead of deleting them.
Keep in mind to be proactive so that you can discover potential churn customers before they really leave. You can do so by segmenting customers who show signs of leaving.
Userpilot lets you build advanced user segments based on:
- user behavior
- custom events
- engagement
- user identification.